Introduction
The aim of this article is to acquaint oneself with the Python library Numba, which enables significant acceleration of Python code through parallel and CUDA computations.
Problem statement
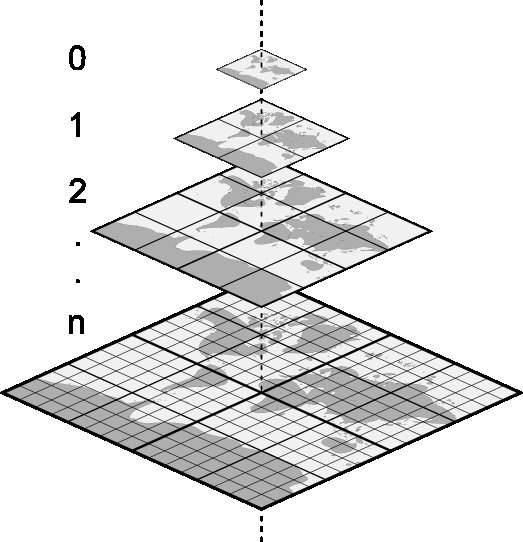
To achieve our goal, we will take a task well-suited for parallel computations and simultaneously visually interesting: generating heatmaps. In any cartographic system, a map is represented as a collection of "small pieces" - tiles. Typically, the first layer depicts the map itself (which we are not responsible for), and on top of it, there is an additional layer with supplementary information, such as heatmaps.
Algorithm
- Obtain a list of geographical coordinates for all "Perekrestok" stores in Moscow
- Download the list of addresses for all stores from the unofficial website
- Use Google's geocoder to convert addresses into geographical coordinates
- Create a map of store accessibility
- For each point within a tile, calculate the distance to each of the stores
- Based on step 2, generate an accessibility map
- Transform the accessibility map into colors (generate an image)
- Visualize the result using a map service geojson.io
The unofficial Perekrestok website is an external resource for us, and in case of changes in its layout, the parser code will cease to function. Therefore, it should be viewed more as an example and template rather than a reliable, industrial solution. Below is a screenshot of the website at the time of writing this article.
We will consider a store "accessible" if the distance from the examined point to the store does not exceed 1.2 kilometers (the distance a person can walk in 15 minutes).
Data preparation
As the subject of our research, we will take the "Perekrestok" store network in Moscow and attempt to visualize the accessibility map of these stores within the city.
Usually, tiles are pre-generated and then served by a tile server. However, since our goal is to accelerate calculations, we will generate them "on the fly." The faster tiles are generated, the better, as it will result in smoother map rendering.
Getting the list of stores
Using the aiohttp library, we will download the page, and then, using the BeautifulSoup library, extract the addresses of the stores from it:
Geocoding
In the previous step, we obtained a list of store addresses. Using Google's geocoder, we will write a function that converts a store's address into geographical coordinates:
The final function, executed (using the asyncio library), first retrieves the list of store addresses, and then obtains the coordinates:
Please note that the function sends no more than 30 requests to the geocoder simultaneously to avoid exceeding Google API's internal limit on the number of concurrent requests.
Tile generation
Getting to know Numba
Numba is an open-source library that employs Just-In-Time (JIT) technology for accelerating computations. JIT compilation, or dynamic compilation, is a technology used to enhance the performance of software systems that use bytecode by compiling the bytecode into machine code during program execution.
Using numba starts with one of the following decorators: njit, vectorize или guvectorize. Let's look briefly at each of them:
njit
This decorator indicates that the function should be compiled by the JIT compiler using the nopython=True flag. On one hand, this prevents the use of external variables and functions within the function. On the other hand, it guarantees its "fast" operation since the code essentially runs as compiled.
vectorize
This decorator is applied to a function whose task is to describe the algorithm that operates on an individual element of an array, often referred to as a scalar. In other words, if we need to add two arrays, the function should describe the addition of two numbers. This function is then called multiple times for each element of the input arrays, and Numba is responsible for parallelizing this process.
guvectorize
The most complex yet flexible approach for processing arrays is where the input arguments are typically arrays, and you work with them internally to produce a result. It's important to note that the function's result is also passed into it as an input argument. In other words, the function is supplied with both input data and an array where the result will be stored (examples will be discussed below).
Let's consider an example: the function provided below calculates the distance between two geographical coordinates:
The function above calculates the distance between two geographical coordinates in kilometers. We are interested in the description of the parameter types for this function as specified in the decorator: f8(f8[:], f8[:]):
f8 - float64 number,f8[:] - 1D array of float64 numbers
Thus, the function takes as input two arrays of floating-point numbers (latitude and longitude pairs) and returns a floating-point number.
Another example: The function below bounds a number from below and above (if the argument is less than the specified minimum, it returns the minimum; if greater, it returns the maximum).
In the context of using Numba, you may sometimes need to write such micro-functions because from the functions accelerated by decorators, you won't be able to call any external functions except for those explicitly described in the library's documentation.
Grid generation
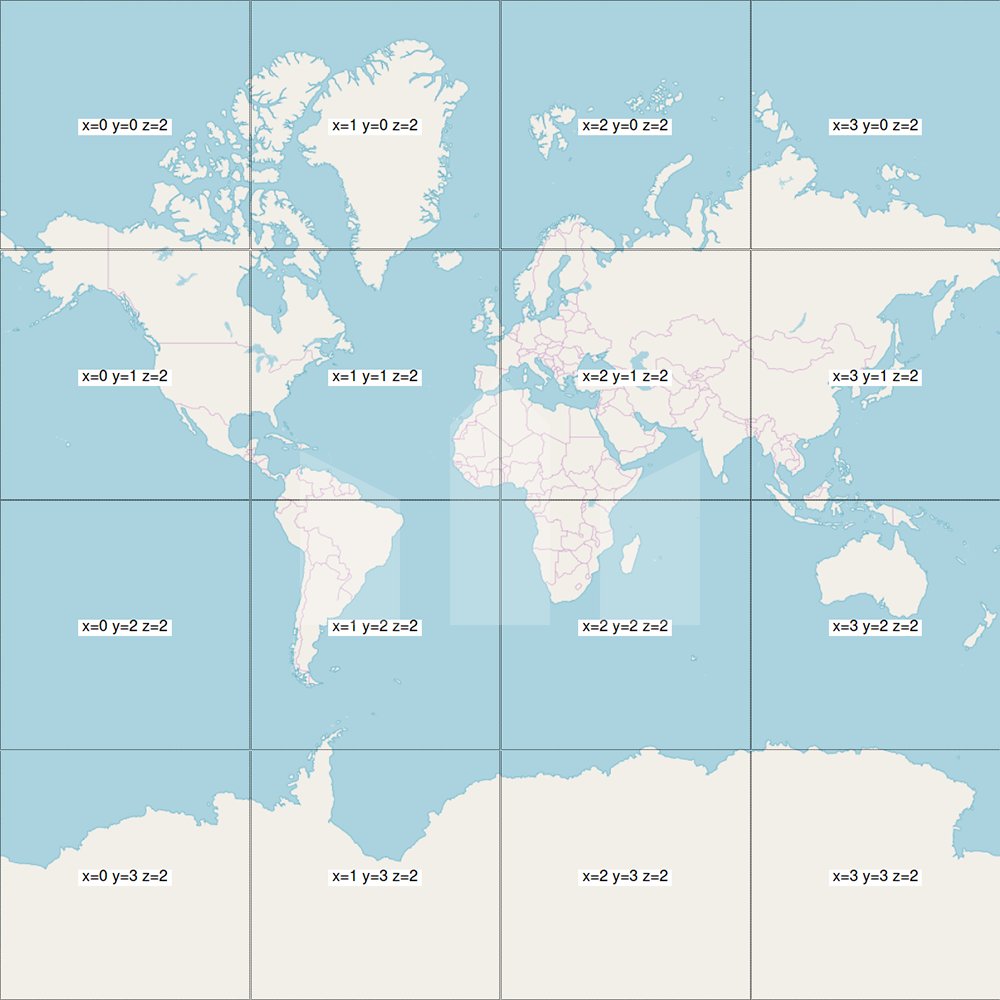
In modern cartographic frameworks, a map is represented as a set of images known as tiles. Each tile has two coordinates and is displayed only at a single level of detail (zoom level). Therefore, a tile is characterized by three numerical values (x, y, zoom).
Based on the tile's size and its coordinates, you need to create an array representing geographical coordinates for each point within the tile. This is an excellent task for parallel computations!
Let's consider the types of arguments specified in the decorator:
-
zeros: An empty three-dimensional float64 array, used to specify the dimensionality of the result argument (more on this below). It's three-dimensional because latitude and longitude are calculated for each point in the tile, which already accounts for two dimensions. For example, element [10][10][1] represents the longitude for a point in the tile with coordinates 10, 10.
-
x_range, y_range: One-dimensional arrays of float64 numbers representing coordinate ranges for each tile. For instance, if we have a tile with coordinates x = 3 and y = 4 and a size of 10 by 10 pixels, we would get x_range = [3, 3.11, 3.22 ... 4] and y_range = [4, 4.11, 4.22 ... 5].
-
zoom: A float64 number representing the level of detail for the processed tile.
-
result: A three-dimensional float64 array in which the function's results will be filled. It serves the same purpose as "zeros" in that it informs the JIT compiler about the dimension of the "result" array, but "result" is an output argument containing the function's results.
The second argument of the guvectorize decorator is the signature, which rigidly defines the dimensionality relationship between the input and output arguments:
(a, b, c), (a), (b), () -> (a, b, c)
Please note that, seemingly, we know that c is always equal to two (latitude and longitude), and it might appear that we could specify the signature something like this: (a), (b), () -> (a, b, 2), eliminating the need for the "zeros" argument. However, this cannot be done, and it is one of the limitations of the Numba library. Numbers cannot be specified in the signature, only variables. Thus, to indicate the dimensionality of the output argument, we pass an empty argument with the same dimension into the function.
The function provided below calculates geographical coordinates for each point within the tile:
Pay attention to the additional flags in the decorator:
target = parallel means "calculate on all available cores." Instead of parallel you can specify cuda which will provide even better performance as it will use the graphics card for calculations.
nopython = True in essence, enables acceleration. In the Numba documentation, it's mentioned that setting this flag to False will switch the compiler into "object mode," where Python objects will be available, but the performance won't exceed that of regular Python functions.
Distance search, Accessibility map generation
Above, we calculated the geographical coordinates for each tile, created an array with the geographical coordinates of points of interest (in our case, these are the store's geographical coordinates), and described a function to calculate the distance between two points.
Based on the fact that 1.2 kilometers is the distance a person can walk in 15 minutes, we will calculate the number of accessible stores for each tile point. Afterward, we will transform this count into an "accessibility" value. We consider a situation where 4 or more stores are accessible in a point to be "ideal" accessibility (the value is manually determined and essentially serves as a form of normalization):
Data → Color
The final step in tile visualization is the transformation of accessibility values into colors. In a typical situation, you could use the colormap function from the matplotlib library. However, as mentioned earlier, we cannot use external libraries in functions accelerated by Numba decorators.
The solution is simple: find an implementation of the desired color scheme in the source code of the matplotlib library and replicate it within the Numba ecosystem. I chose the "jet" color scheme:
The function provided below transforms accessibility values into colors. Pay attention to the signature in the decorator, which indicates that the input and output arrays have the same dimensionality. Logically, this might seem strange, as accessibility is a single number, while color is represented by four components.
After constructing the accessibility map, we change the 256x256 array into a 256x256x4 array, which allows us to specify the dimensionality of the final array in the decorator. Accessibility is recorded in the first component of each element in the input array.
Example:
- Source accessibility map:
A = 256x256 → A[i][j] = val
- Extended accessibility map:
A = 256x256x4 → A[i][j] = (val, 0, 0, 0)
The final tile generation function
Now that all the constructor's details are implemented, the only thing left is to put them in the correct order. Below is the function that generates a PNG image of the accessibility map for a given tile. This image can be overlaid on a map as a layer!
Result
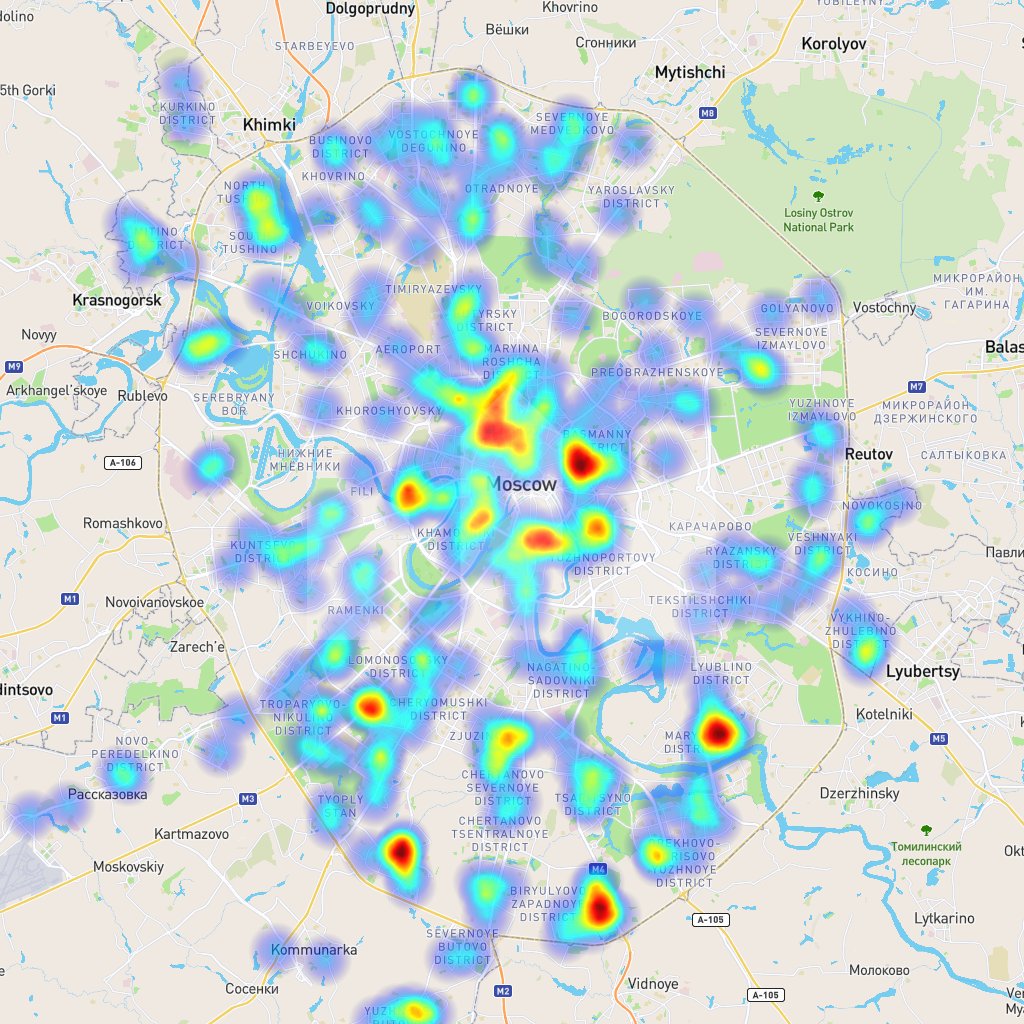
Accessibility map of "Perekrestok" stores in Moscow
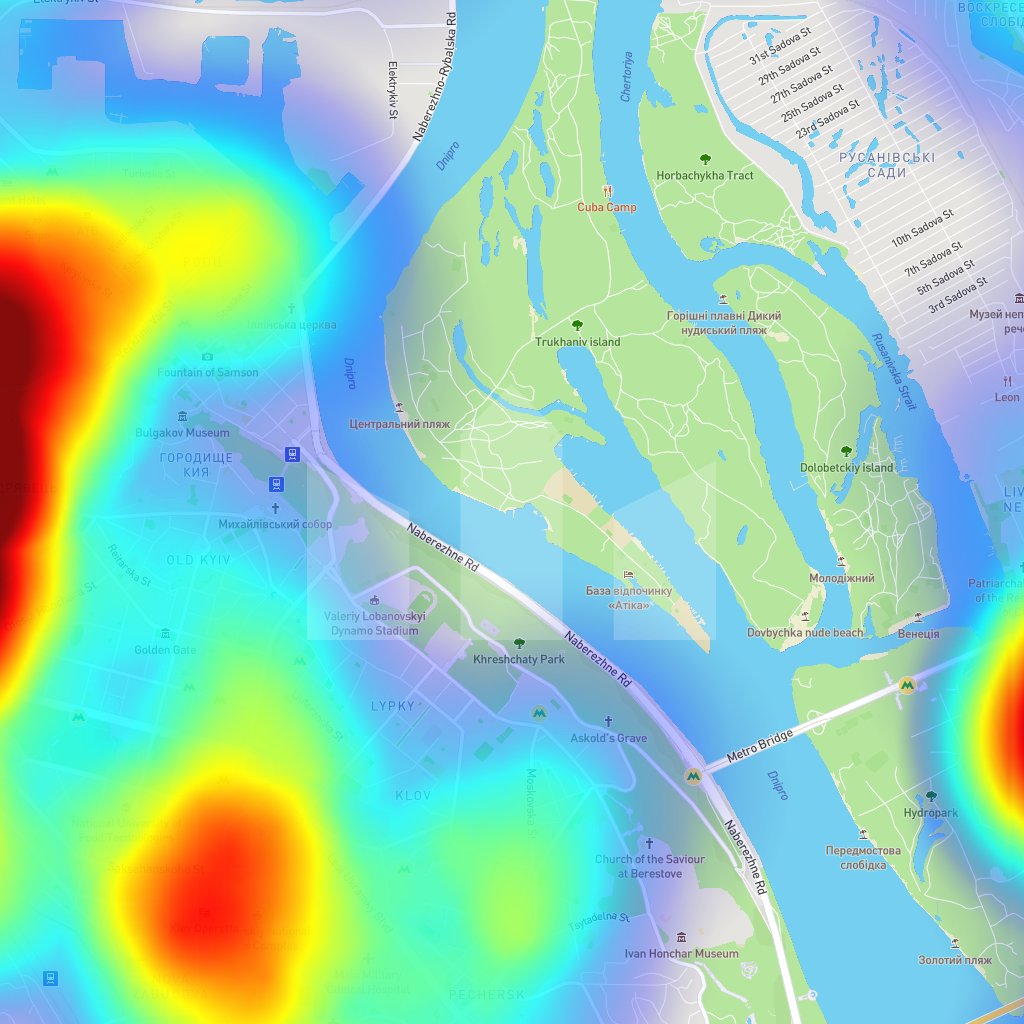
Accessibility map of post offices in Kiev
Optimization
Bonus section! Let's exclude from processing those points of interest that won't contribute to the final tile result.
To do this, we will check the following condition for each point: the distance from the point of interest to the nearest point within the tile must exceed the barrier distance (1.2 km). The easiest way to check this is by subtracting the distance from the point of interest to the tile's center from the distance from the point of interest to the tile's boundary (see the image below):
This simple piece of code can significantly speed up the tile generation function because it first filters out all the points that won't have any impact on the tile at all. Then, the resulting array of points that affect the tile is used to build the accessibility map.